As we draw ever closer to ThinIO’s big day, I thought I’d put a blog post together talking about the RAM caching, statistics, facts and figures we’ve baked into version 1 to deliver some really kick ass performance improvements with even the smallest of allocations of cache per VM.
Test, test, review and tune. Rinse and repeat!
We’ve spent months load testing, tuning, fixing and retesting ThinIO. And for the first time we’re going to start talking about the dramatic results ThinIO can have on storage scalability and user perceived performance.
During our extensive testing cycles, we’ve covered:
• Horizon View
• Citrix XenDesktop
• Microsoft RDS
We’ve been seeing very similar, if not identical results when testing against pools on the following storage types too:
• XenServer SR
• VMFS
• NFS
• Microsoft Clustered Shared Volumes
For reference the statistics we’re sharing today are based on VDI via VMware Horizon View 6, these figures are averages across at least three independent tests. All details of the tests that exported these results are covered below.
Testing details:
The VM’s we tested in this particular workload are as follows:
• Testing Method: Login VSI 4.1 Medium Workload
• Operating System: Windows 7 x64 SP1
• System ram: 3gb
• vCPU: 2
• ThinIO cache: 350mb
• Technology: VMware Horizon View 6
• Test runtime: 1 hour*
• Statistic sample period: 5 seconds.
With that out of the way, lets jump right in!
Storage IO:
The number of IO’s per second is crucially important when dealing with storage; many, many small IO’s sent to sparse locations on disk are a killer to storage technologies, only made worse by certain file systems.
As a storage acceleration and negation technology, were extremely happy with the IO’s reduction we see on the storage:
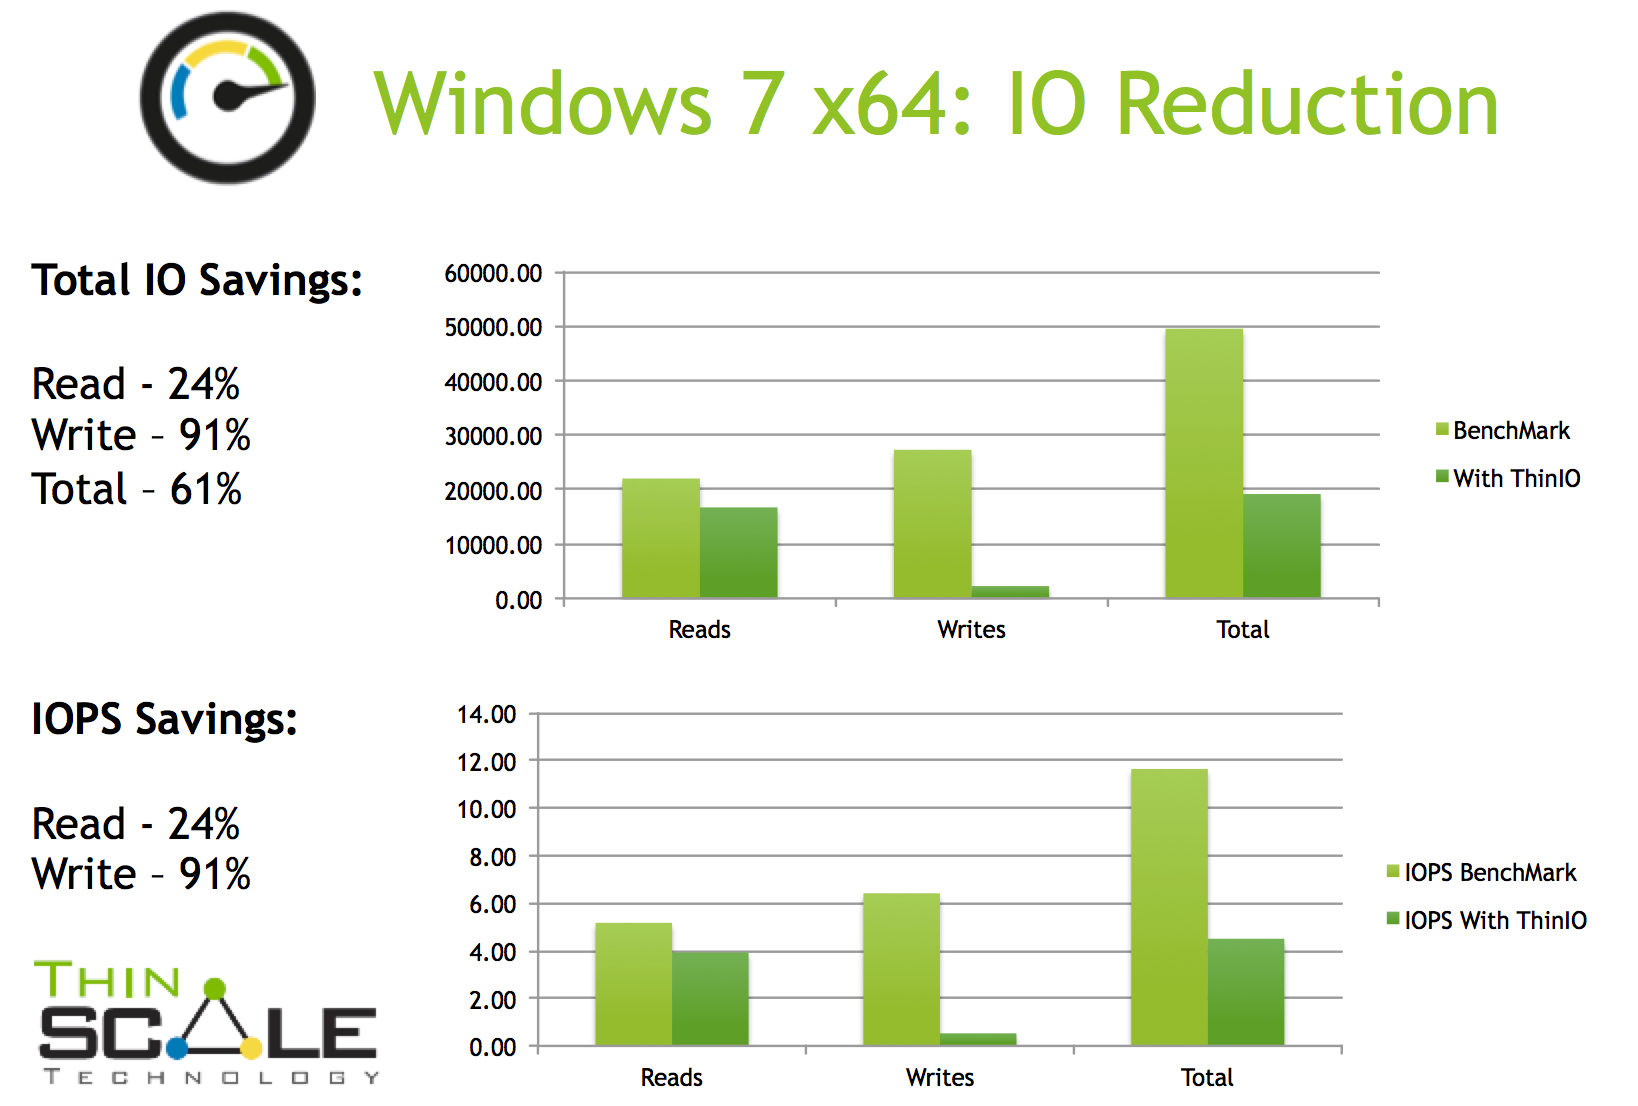
Even with just 350 MB of ram as a cache, we achieve phenomenal IO reduction.
Storage MB / Sec:
But IO’s are just one part of the puzzle, what about the size of the data requests being sent to the storage?
A true solution to take the pressure off the SAN, improve user performance, and increase storage density needs to tackle both the IO and the throughput problem.
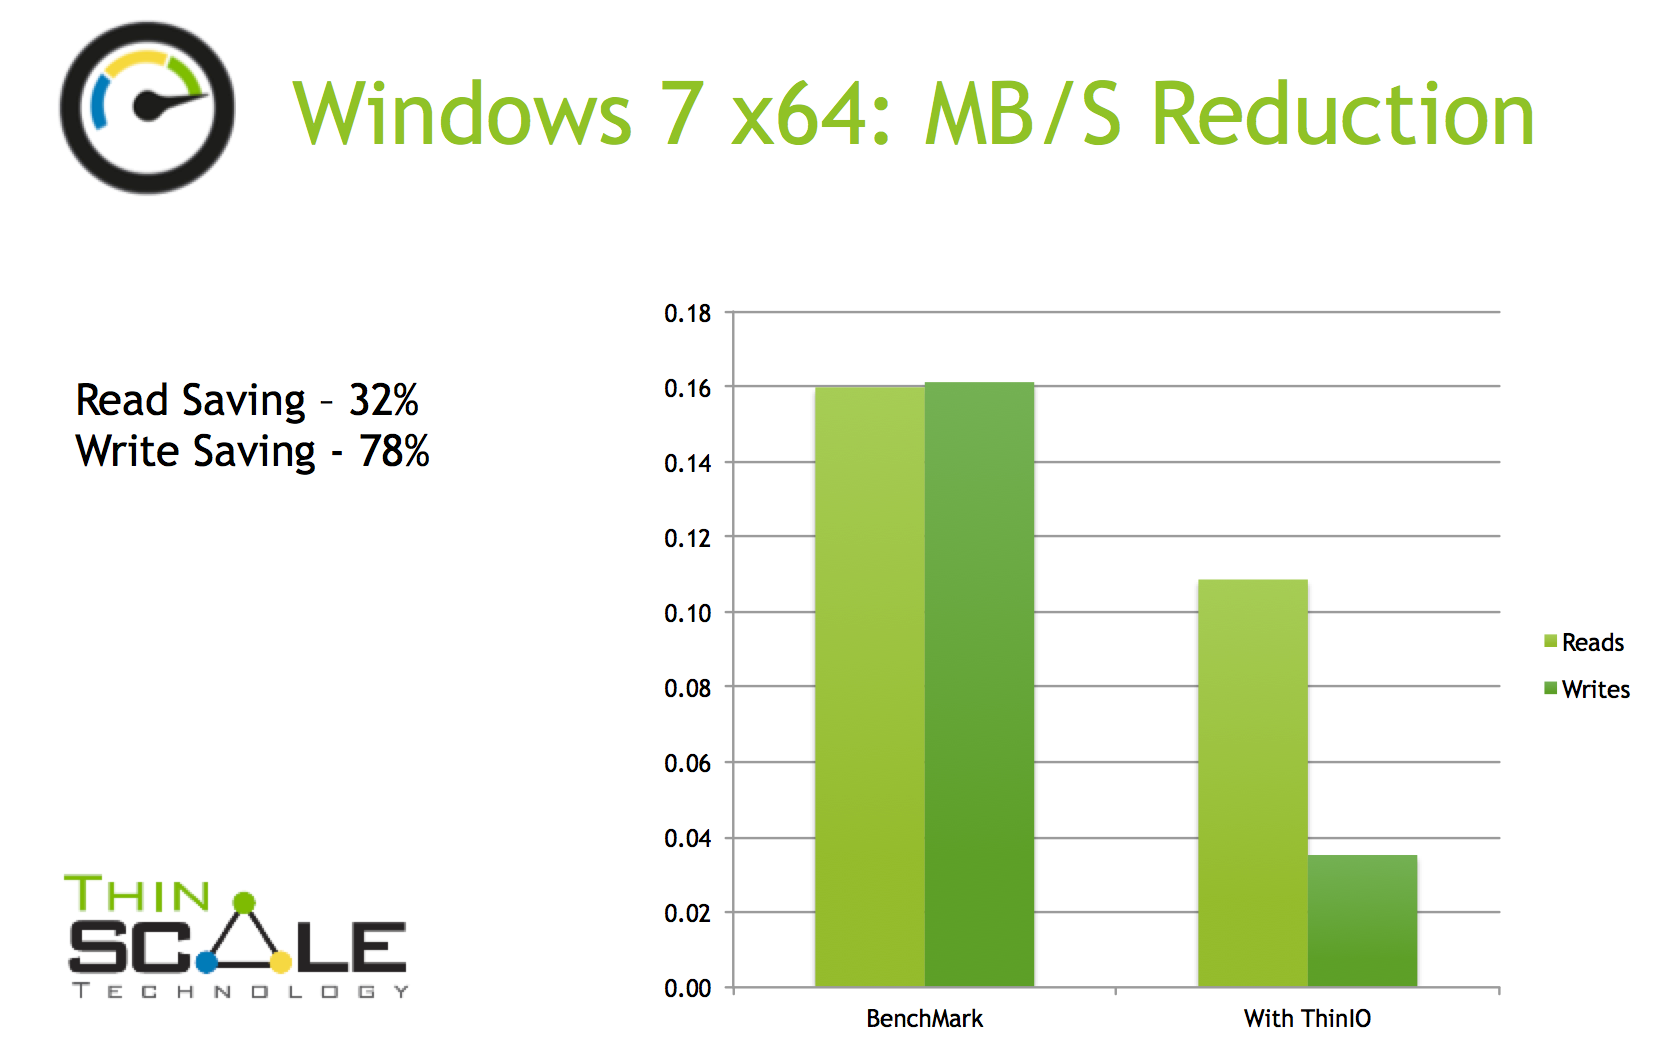 As you can see above, with just 350mb we’re very good at it!
Side by Side Comparison:
So rounded figures are fine so long as the data is trustworthy, but here’s a real preview laid bare for your analysis. Here’s a direct comparison on NFS and VMFS of taking a standard load test IO pattern and comparing it to an identical test with ThinIO installed in the VM:
VMFS:
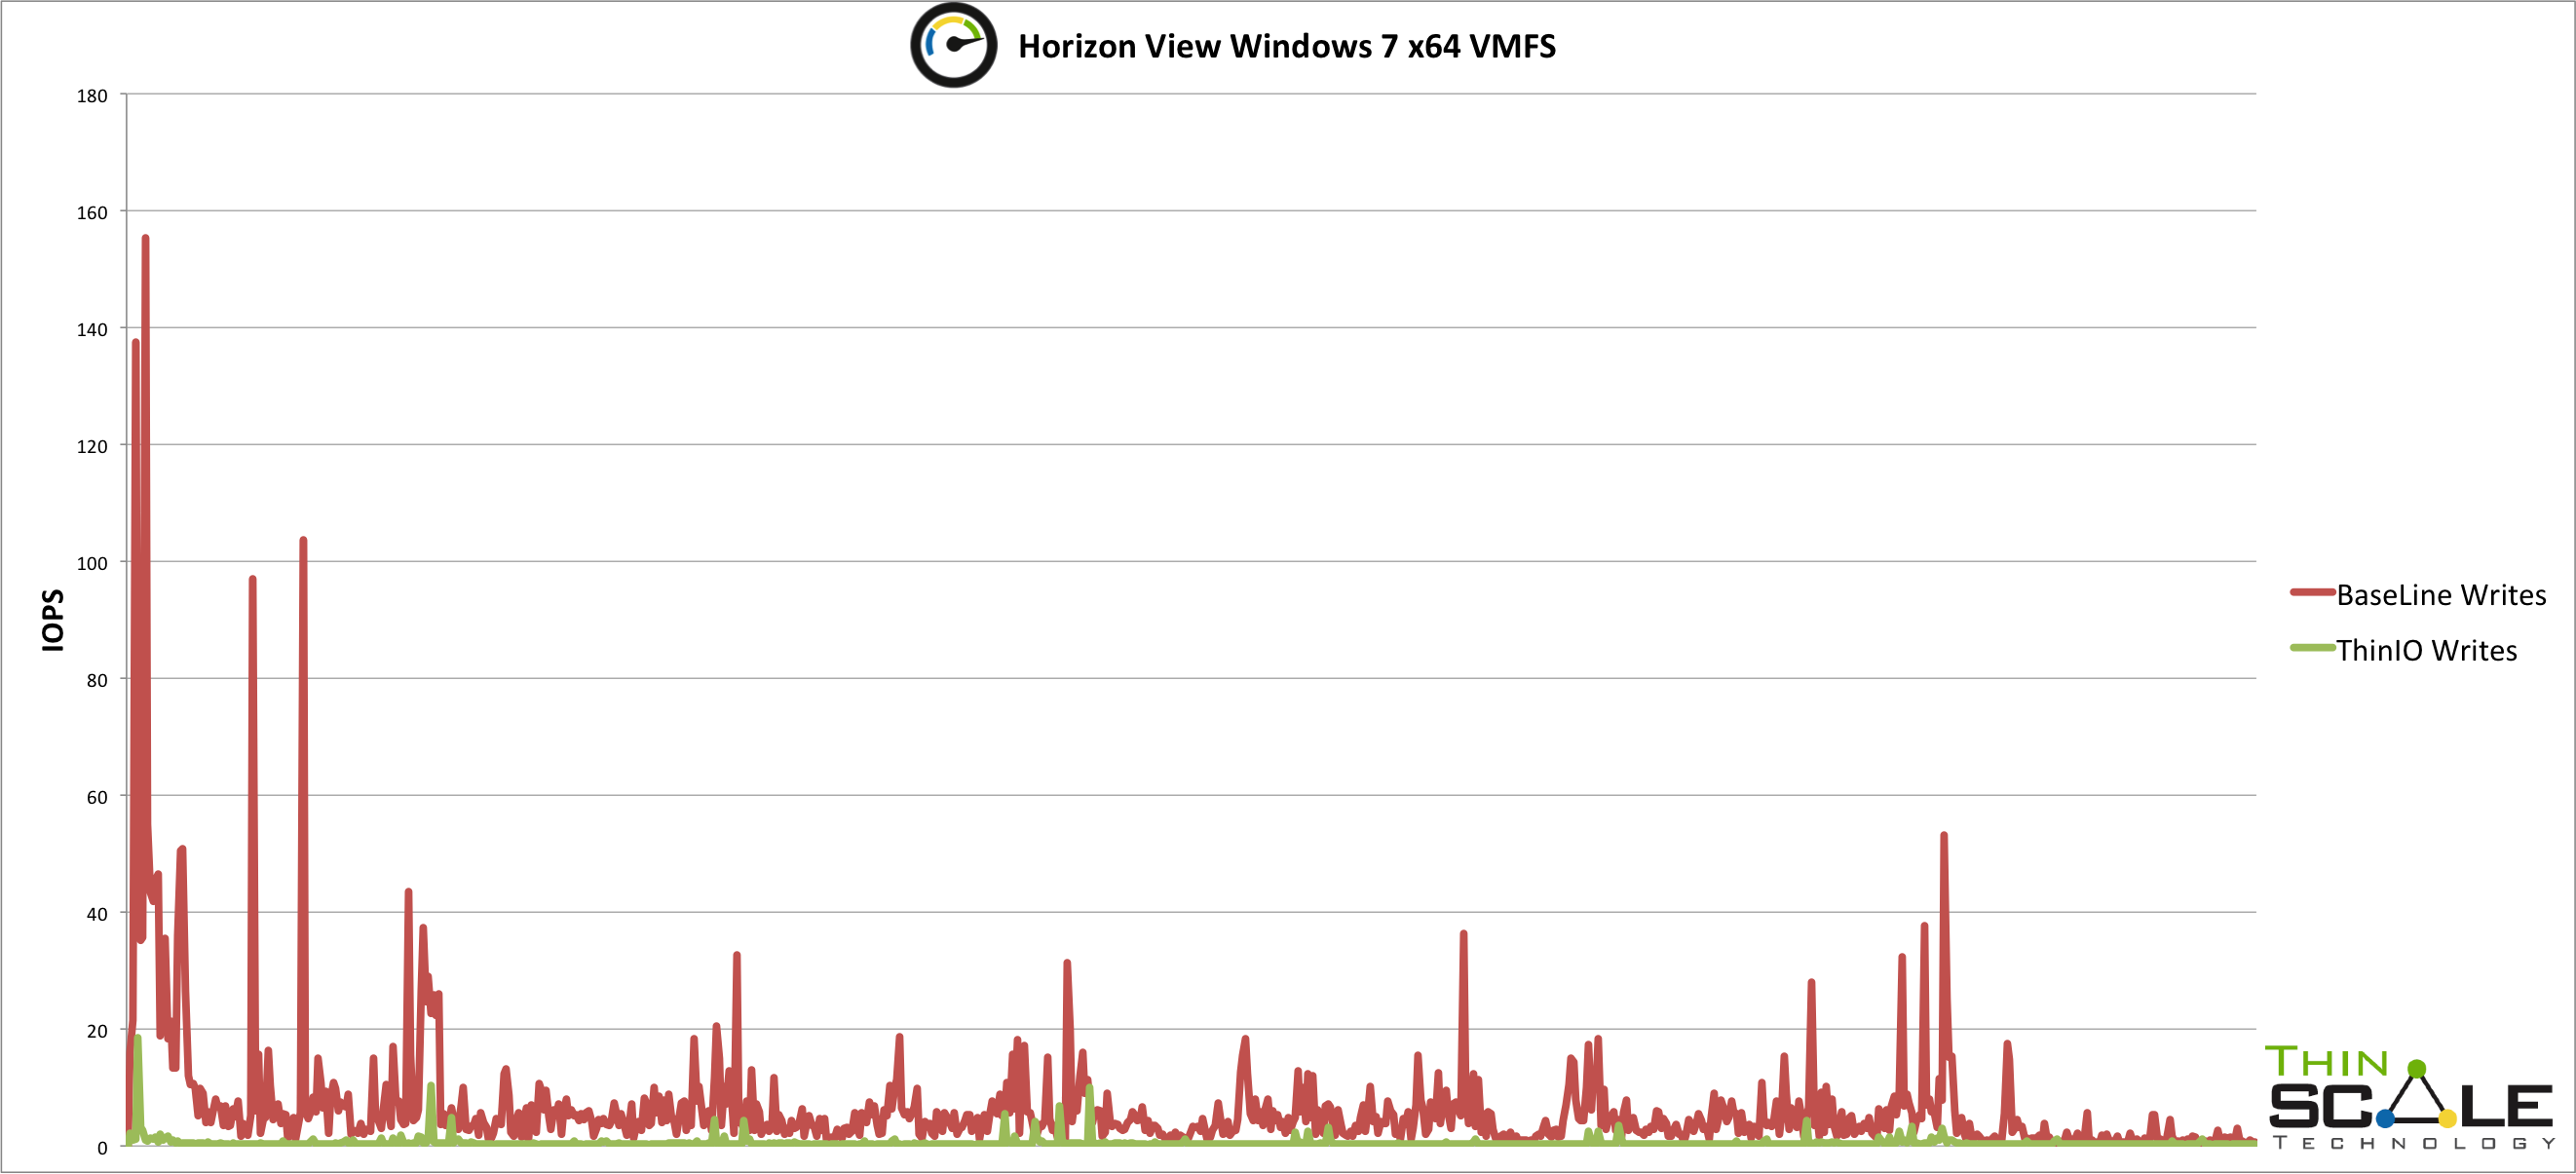
NFS:
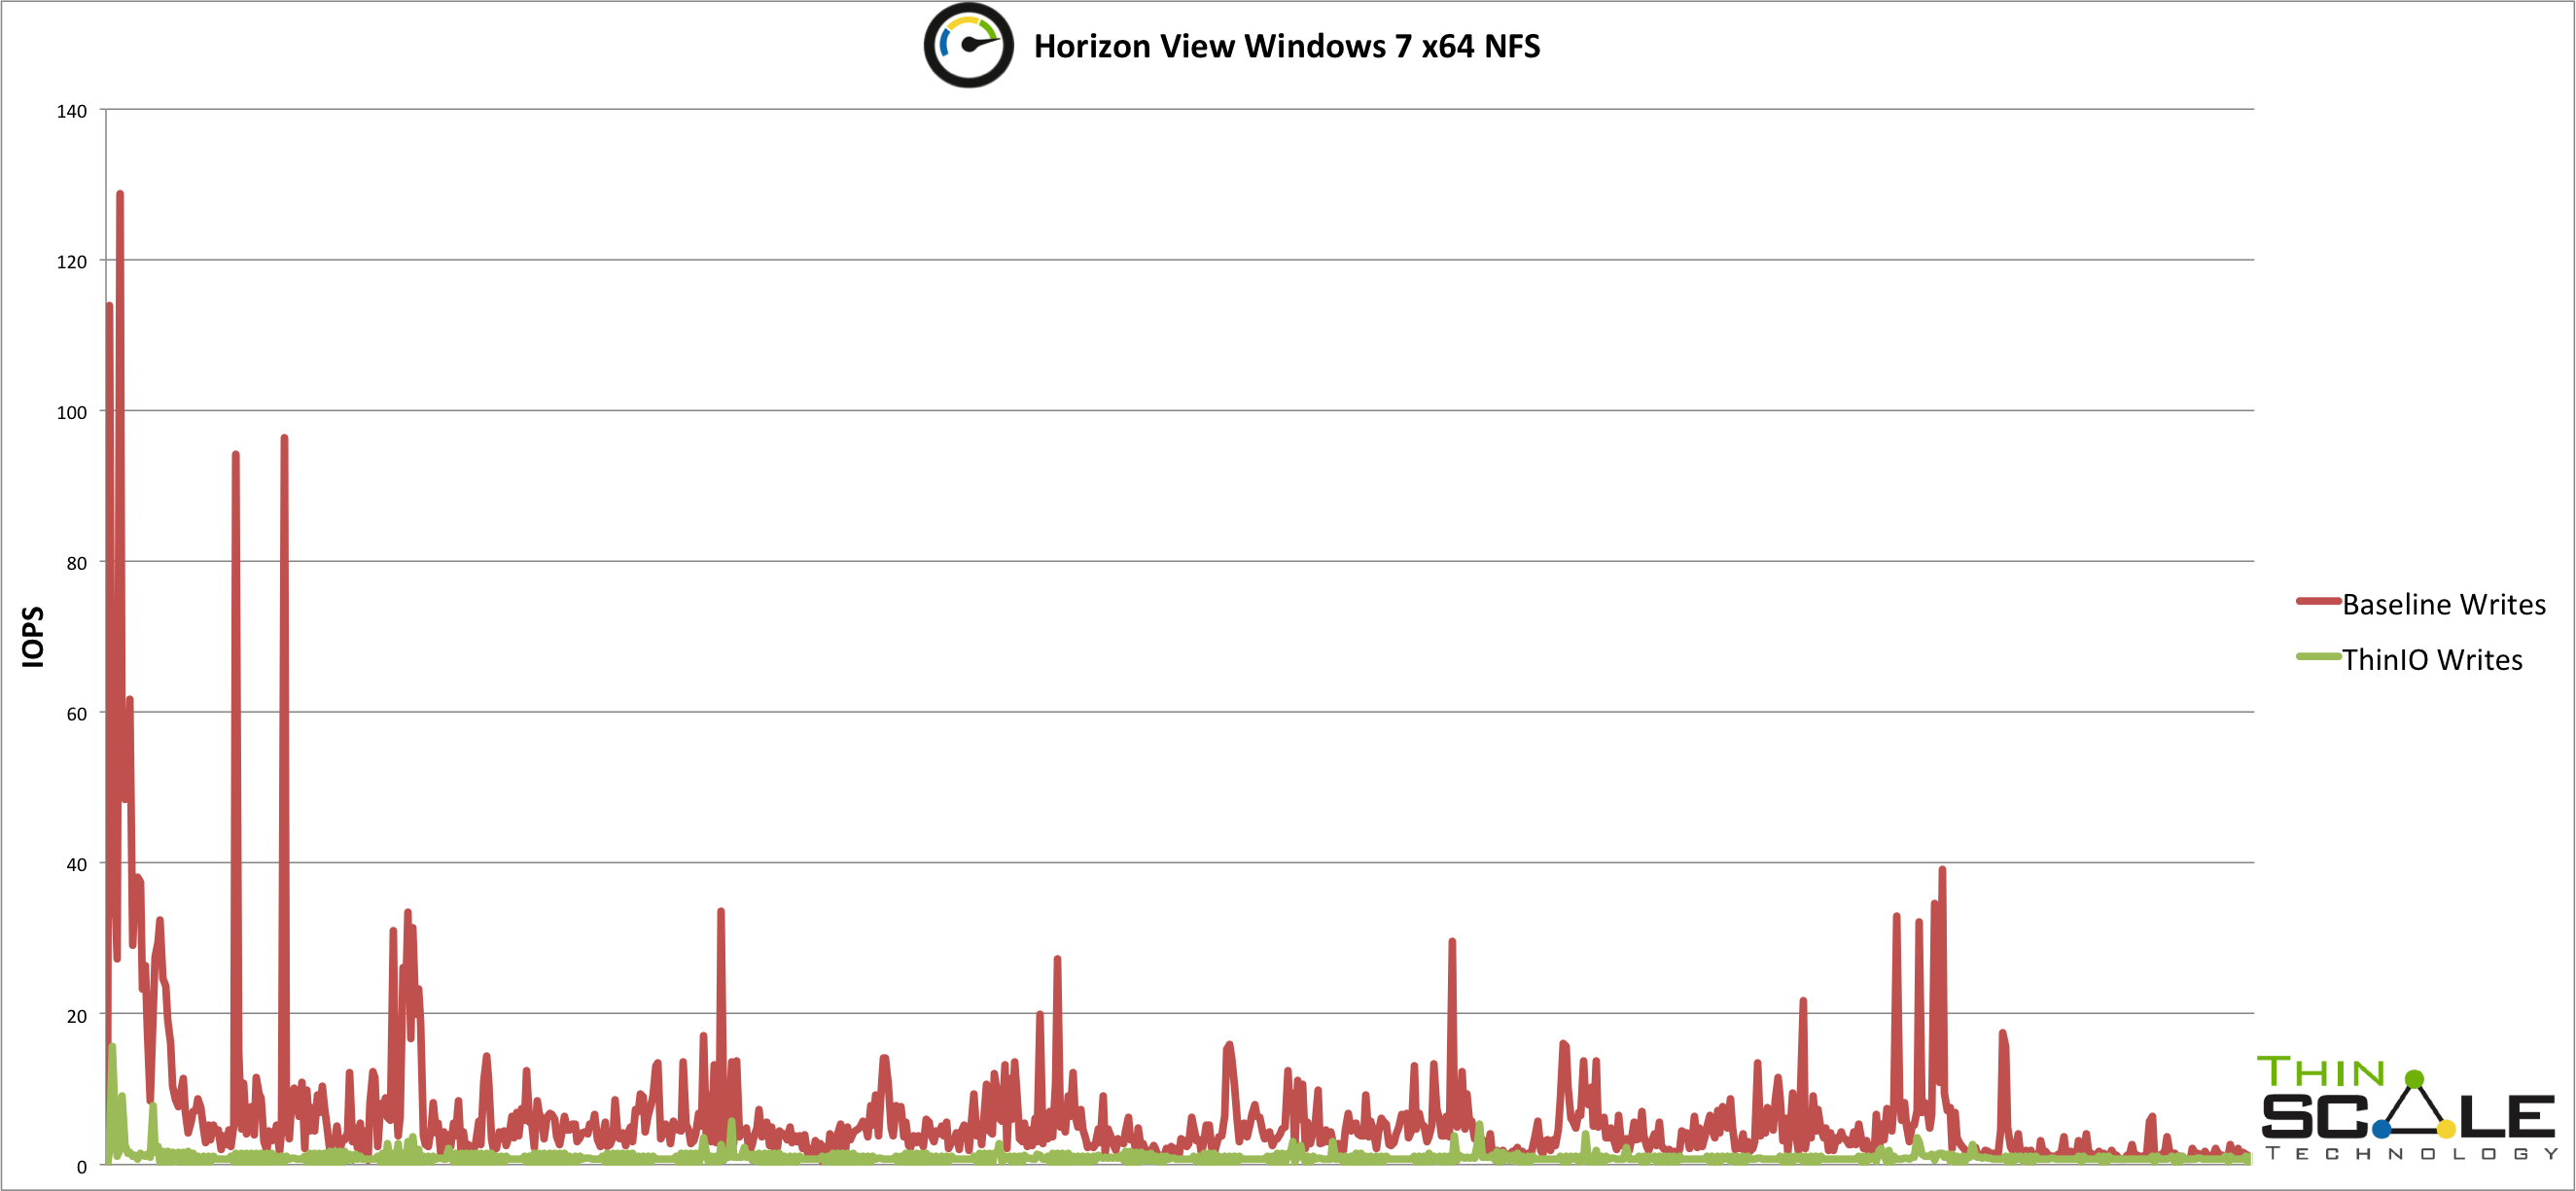
As you can imagine, we’re extremely proud of what we can achieve with as little as 350mb per desktop.
The beauty of our approach is simplicity, your users can see this benefit not in a matter of weeks, days or even hours. ThinIO can be up and running in minutes, delivering reduced login times, storage acceleration and providing a far deeper density on your current storage.
Wrap up:
So there you have it, we’ll be adding additional blog posts in the coming days looking at Remote Desktop Services / XenApp, intelligent cache management built in and our Read Ahead technology, so check back.
In the mean time, if you would like a chance to test ThinIO pre-release, find access to the public beta below. Thank you for your time and happy testing!
* Eight-hour figures and complete statistics are also available, we have nothing to hide and we’d encourage you to get in touch with the ThinScale team and we’ll share them with you.
Source: ThinIO